A borderless product
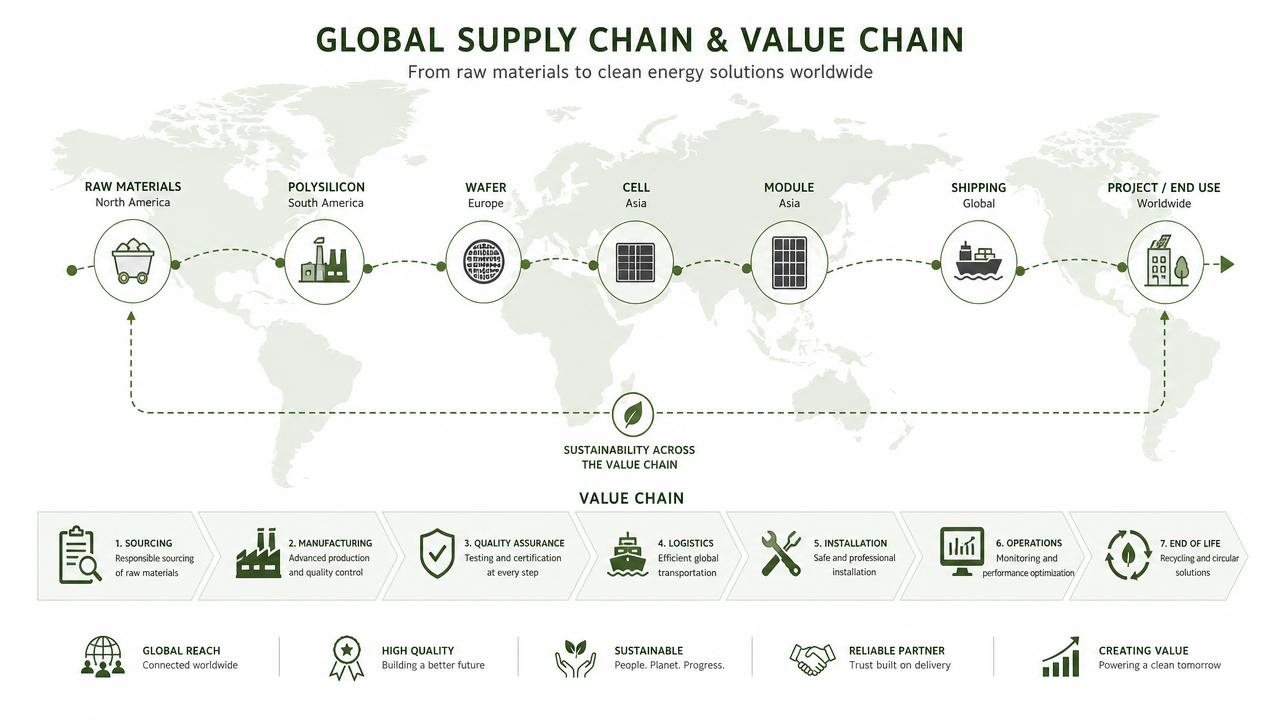
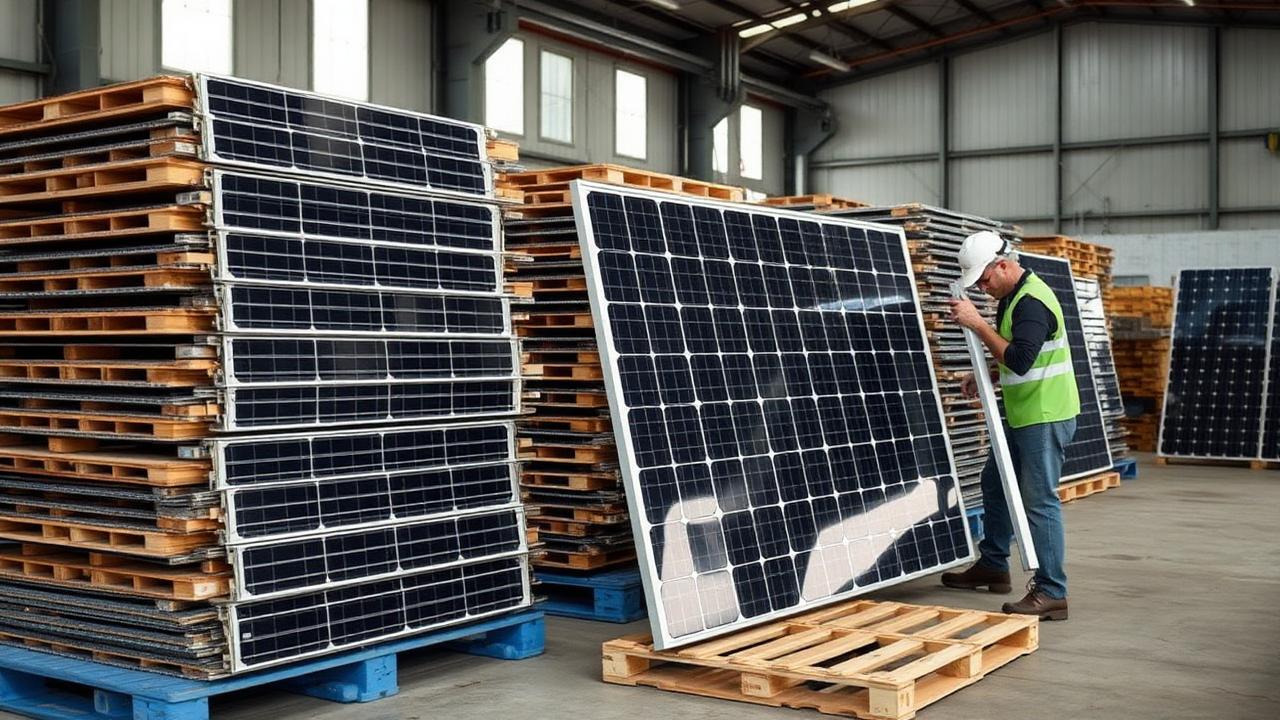
Polysilicon, ingots, wafers, cells and modules are often produced in different countries before a finished panel reaches a rooftop.
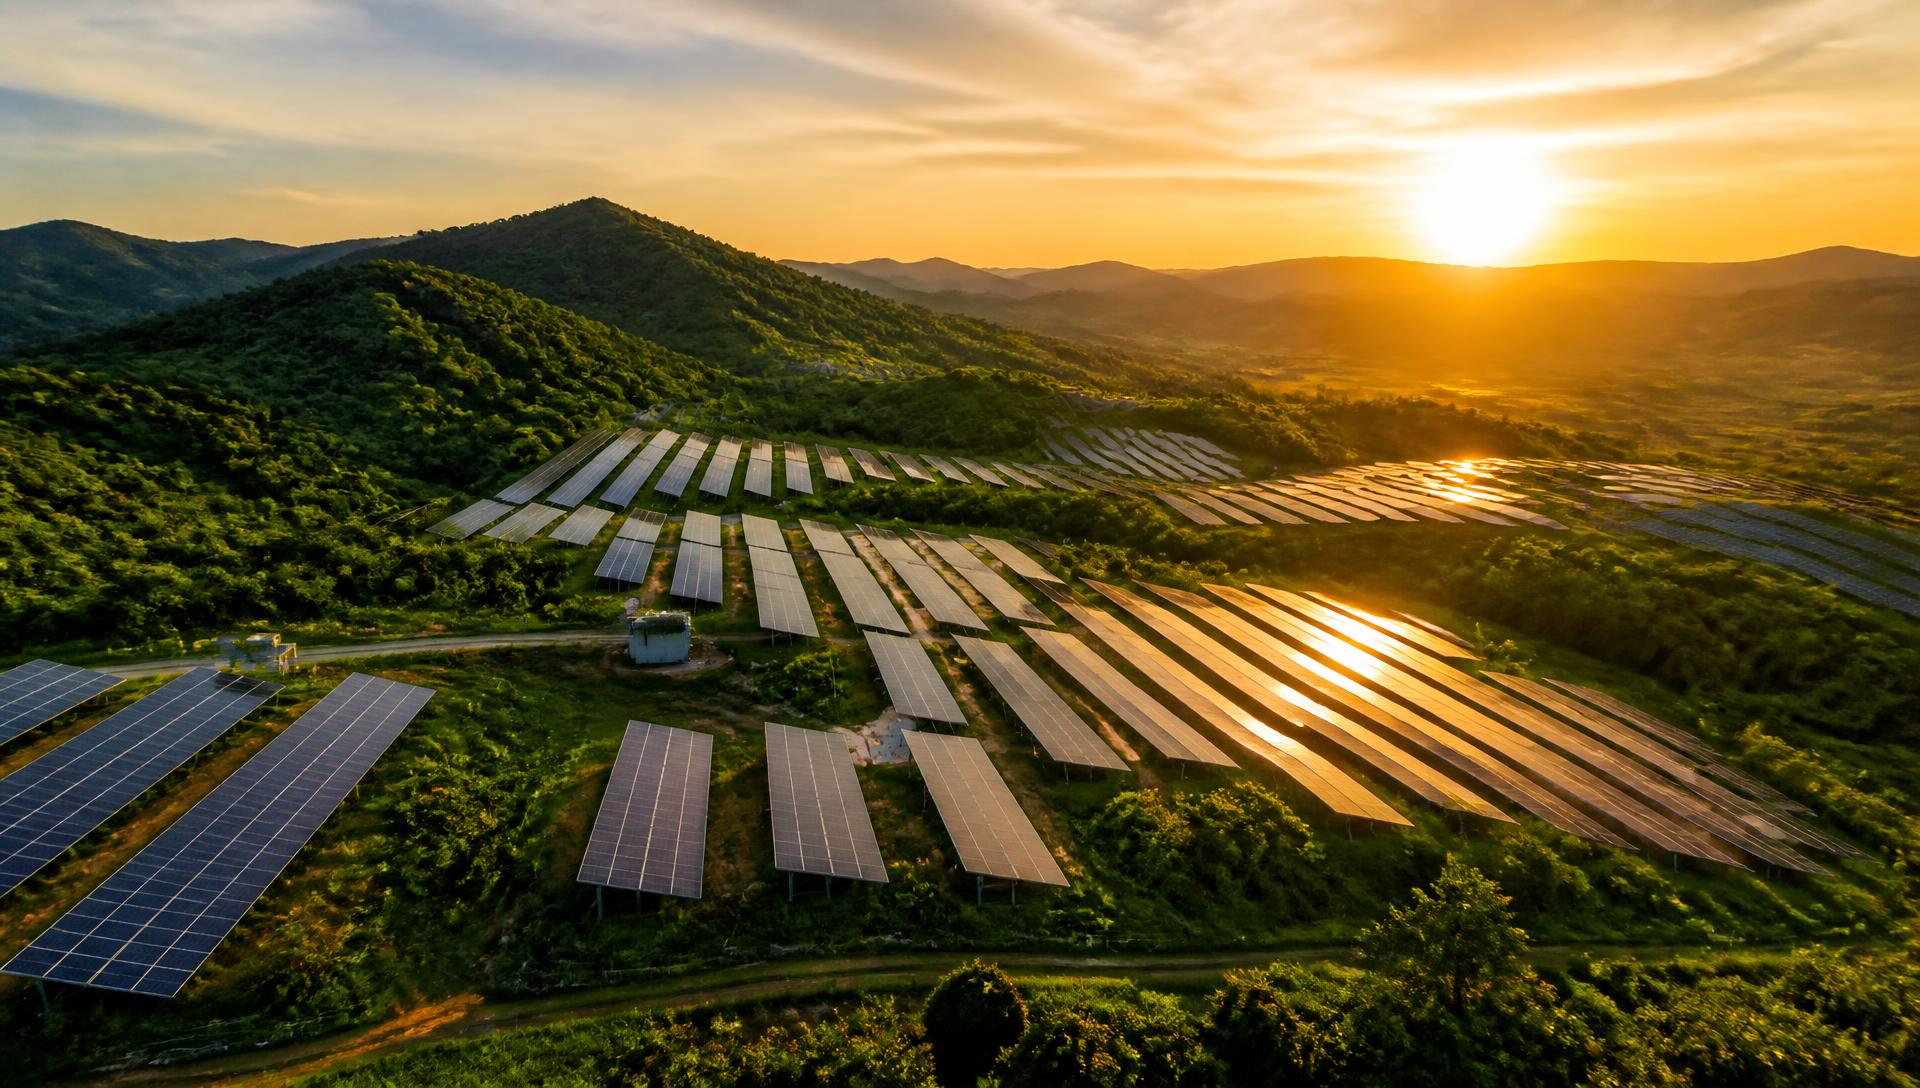
A single panel begins as quartz mined from the Earth, travels across continents for refining and assembly, generates clean electricity for over 25 years, and can finally be recycled into new products — connecting mining, manufacturing, global trade and the energy transition.
Chapter 01
Solar photovoltaics convert sunlight directly into electricity with no air pollution or greenhouse gas emissions during operation. Quartz may be mined in one country, refined into silicon in another, assembled elsewhere, and finally installed thousands of kilometres away — a genuinely global product.
Polysilicon, ingots, wafers, cells and modules are often produced in different countries before a finished panel reaches a rooftop.
Manufacturing is electricity-intensive, yet a module repays its carbon debt within roughly 4–12 months of operation.
Judging solar only by its clean electricity hides upstream mining, chemicals, water use and end-of-life challenges.
Main components of a solar panel
| Component | Function |
|---|---|
| Tempered glass | Protects cells while transmitting >90% of sunlight |
| Silicon cells | Convert sunlight into electricity |
| EVA encapsulant | Shields cells from moisture and vibration |
| Aluminium frame | Structural support and durability |
| Backsheet | Electrical insulation and weather protection |
| Junction box | Transfers electricity to external circuits |
Types of solar panels
| Type | Efficiency | Market share |
|---|---|---|
| Monocrystalline | 20–24% | ≈80% |
| Polycrystalline | 15–18% | Declining |
| Thin-film | 10–13% | Niche |
Chapter 02
Solar panels are high-value exports: advanced manufacturing, long product life and surging global demand. Global imports grew threefold from $16 billion in 2014 to $48 billion in 2024, while production stayed concentrated in a handful of Asian manufacturing clusters.
USD billion, 2014–2024. Source: trade data compilation.
Approximate share (%) across polysilicon, wafers, cells and modules.
Major exporting countries
| Rank | Country | Key strength |
|---|---|---|
| 1 | China | Integrated ecosystem and economies of scale |
| 2 | Vietnam | Large export-oriented manufacturing |
| 3 | Malaysia | High-quality modules, foreign investment |
| 4 | Thailand | Regional manufacturing hub |
| 5 | Germany | Premium and specialised PV products |
Major importing countries
| Country | Reason for high imports |
|---|---|
| United States | Utility-scale solar expansion |
| India | Rapid renewable energy demand growth |
| Germany | Energy transition (Energiewende) |
| Brazil | Rising rooftop solar adoption |
| Netherlands | Distribution hub for Europe |
| Australia | High residential solar penetration |
| Japan | Limited domestic manufacturing |
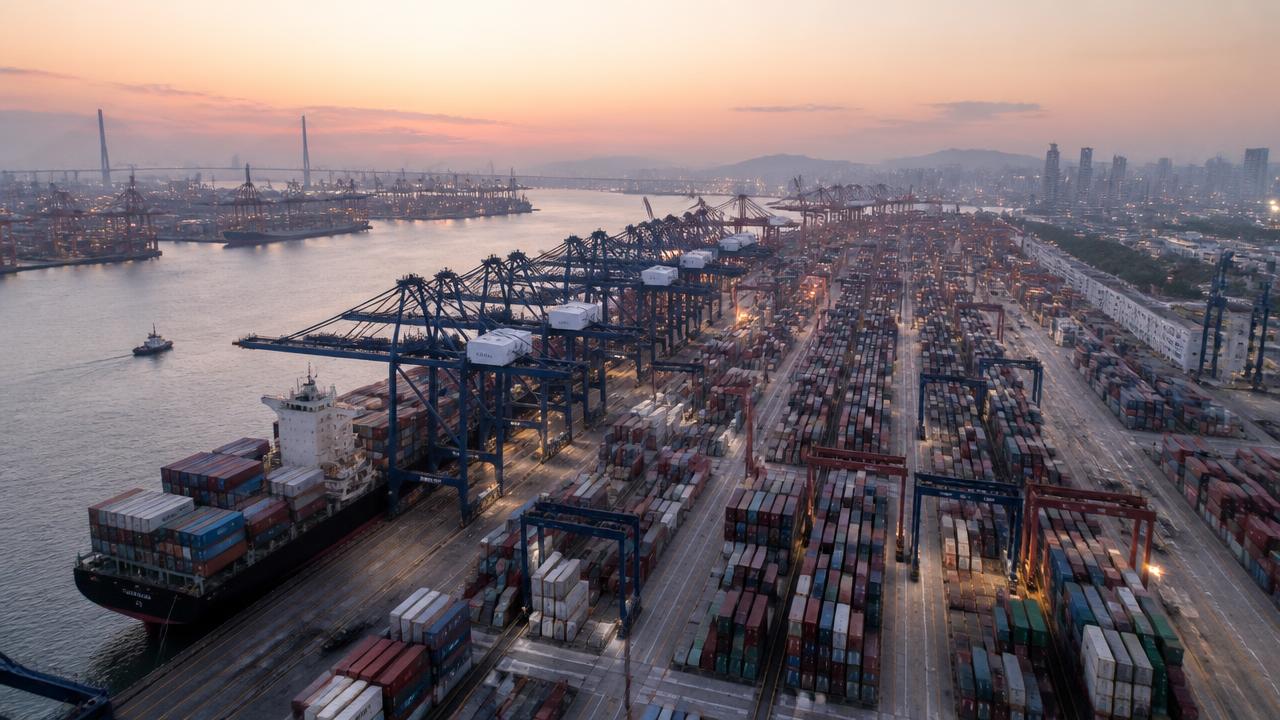
Across the Indian Ocean to the world's fastest-growing solar market.
Shanghai to Rotterdam via the Suez Canal — around 20,000 km.
Trans-Pacific container routes serving utility-scale projects.
Chapter 03
A headline export figure is gross value; only part of it stays in the exporting economy. Separating gross flows from domestic value-added explains why a solar trade deficit can be the signature of a healthy, integrated economy rather than a weakness.
Approximate split (%) of module export value: green = value created at home, gold = imported content re-exported.
Approximate share (%) of the final delivered module price by stage.
Reading the trade balance correctly
| What the headline says | What value-added analysis shows |
|---|---|
| Large module import bill | Capital goods purchase, amortised over 25 years |
| Export surplus in assembly hubs | Mostly imported cells and wafers re-exported |
| Deficit with one supplier | Concentration risk, not a competitiveness verdict |
| Falling import prices | Terms-of-trade gain for the importing economy |
| Rising local content rules | Higher near-term cost, deeper long-term value capture |
Chapter 04
By mass a panel is mostly glass and aluminium; by impact, the small silicon and precious-metal fractions dominate, because refining them demands extreme heat and 99.9999% purity.
Percentage by mass for a standard crystalline-silicon module.
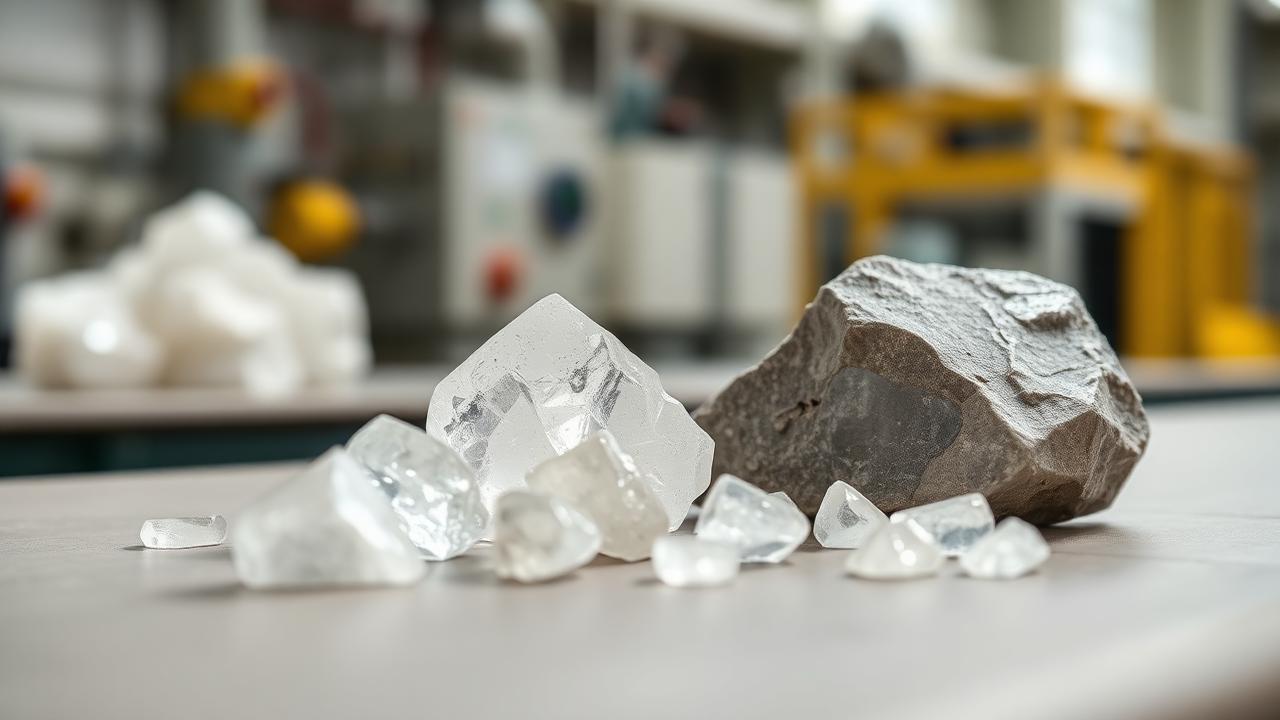
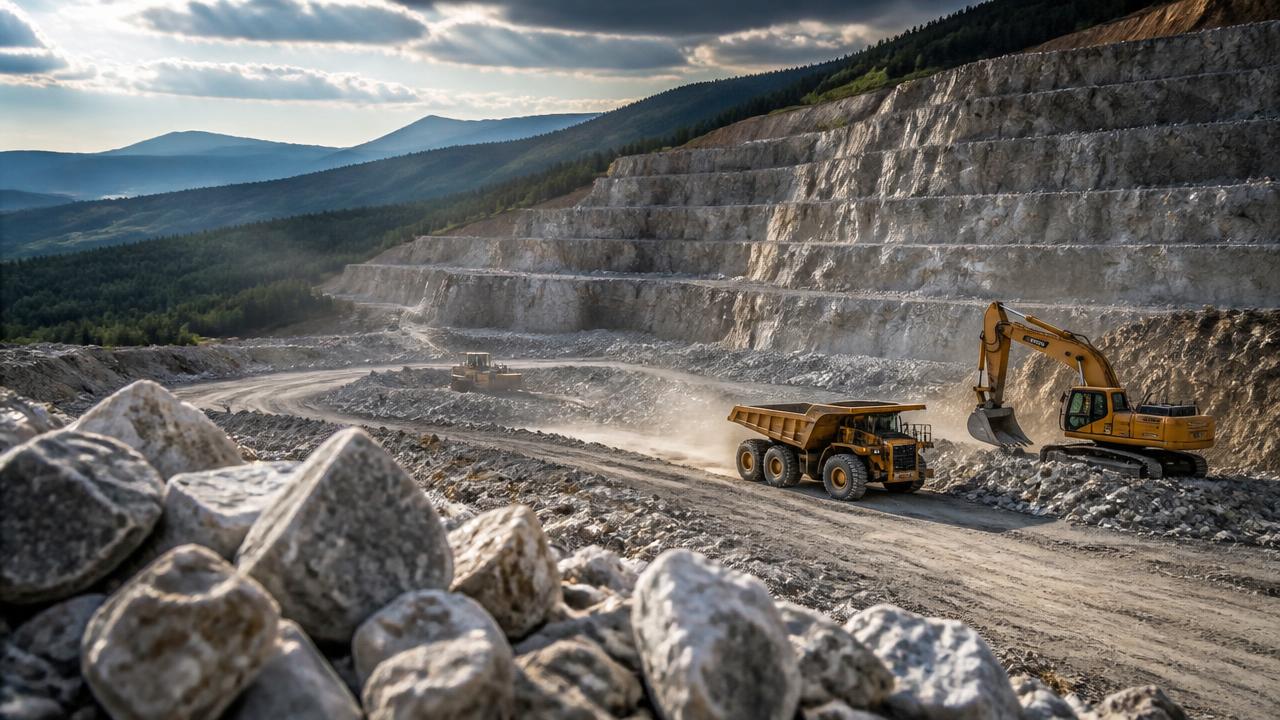
High-purity quartz from China, the USA, Brazil, India and Norway is smelted into metallurgical silicon at ~2,000°C.
About 95% of panels sold use crystalline silicon; solar-grade polysilicon reaches 6N (99.9999%) purity.
Tempered glass transmits over 90% of light; around 95% of the aluminium frame is recoverable; copper carries the current.
Silver paste forms the contacts, EVA encapsulates the cells and the backsheet seals the module against weather.
Chapter 05
Seven precision steps turn mined quartz into a working module. This stage carries 60–80% of a panel's lifetime emissions, almost entirely through electricity use — roughly 80% of manufacturing energy demand is electric.
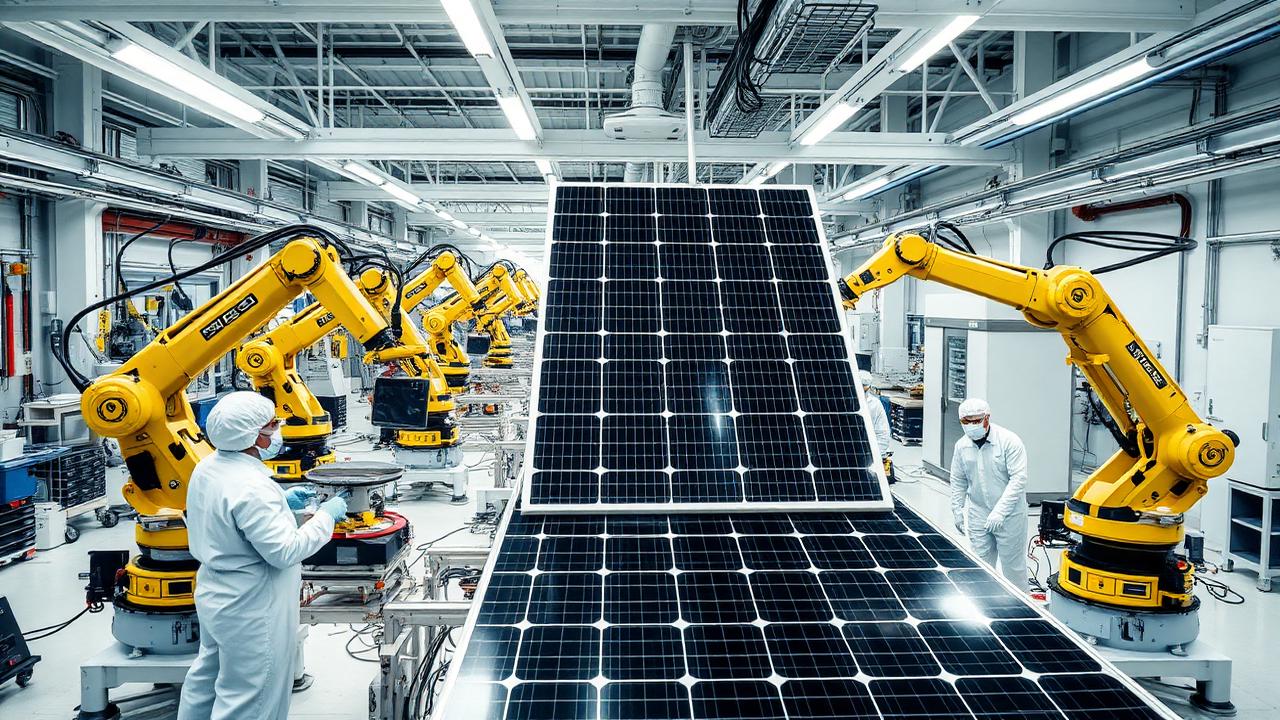
High-purity quartz extracted and shipped to processing plants.
SiO₂ + 2C → Si + 2CO in arc furnaces at ~2,000°C; 98–99% pure.
Siemens-process purification to 99.9999% — the most electricity-intensive step.
Polysilicon melted and solidified; monocrystalline ingots dominate.
Diamond-wire saws slice wafers just 150–180 micrometres thick.
Texturing, doping, anti-reflective coating, silver screen printing, firing.
Glass, EVA, cells, EVA, backsheet, frame and junction box laminated.
Electrical flash testing, quality control, then protective packaging.
Process chemicals and their purpose
| Chemical | Purpose |
|---|---|
| Hydrofluoric acid (HF) | Etching silicon |
| Hydrochloric acid (HCl) | Cleaning |
| Nitric acid (HNO₃) | Surface treatment |
| Sulfuric acid (H₂SO₄) | Cleaning |
| Sodium hydroxide (NaOH) | Texturing |
| Isopropyl alcohol (IPA) | Cleaning |
Wafer cleaning, chemical treatment and cooling dominate water use; modern fabs increasingly recycle process water.
High electricity demand, silver dependence, chemical waste handling and supply-chain concentration in a few countries.
Perovskite and tandem cells, silver-free copper metallization, ultra-thin wafers, AI quality control and renewable-powered factories.
Chapter 06
Panels are fragile, heavy and glass-fronted. Purpose-built packaging keeps breakage below 0.5% on international shipments, while accounting for only 2–5% of shipment weight.
Common packaging materials
| Material | Purpose | Recyclability |
|---|---|---|
| Corrugated cardboard | Protects against scratches and impact | High |
| Wooden pallets | Supports stacking and forklift handling | Reusable |
| LDPE stretch film | Prevents moisture and dust ingress | Recyclable |
| Foam corner protectors | Absorbs shocks and protects edges | Limited |
| Plastic straps | Secures the load in transit | Recyclable |
| QR codes and labels | Identification and traceability | — |
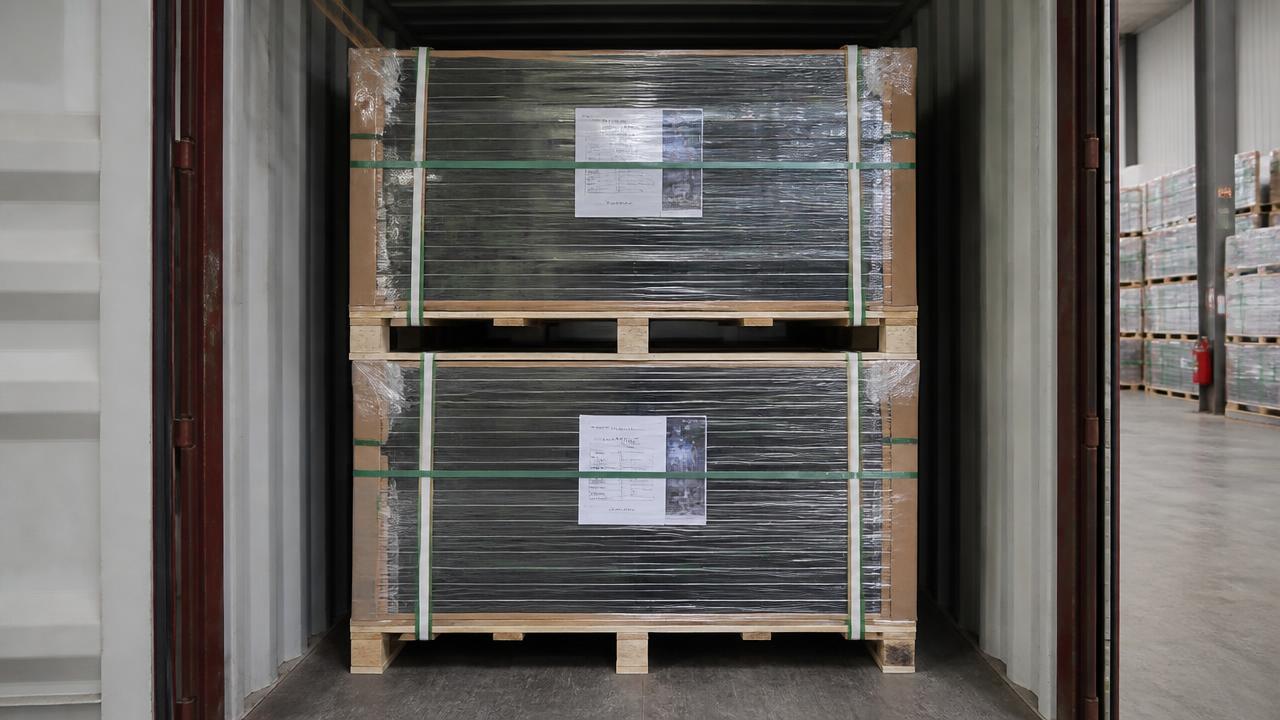
A 40-foot container carries roughly 600–700 standard modules depending on dimensions and packaging design.
FSC-certified cardboard, reusable pallets, reduced plastic wrap, biodegradable cushioning and water-based inks.
Better cushioning and container packing raise panels per container and cut emissions per module delivered.
Chapter 07
Over 90% of internationally traded panels move by sea, covering 5,000–20,000 km. Despite those distances, transport contributes only about 2–5% of life-cycle emissions — ocean freight is remarkably efficient per tonne-kilometre.
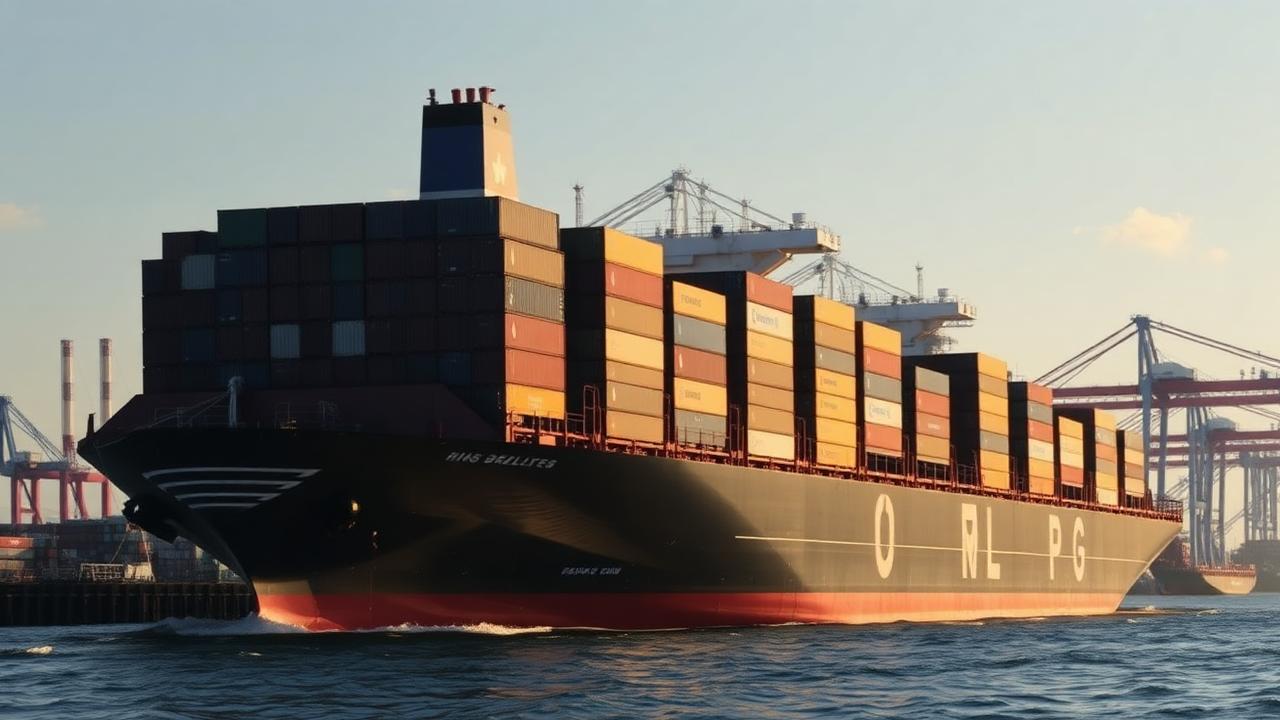
Modes of transport
| Mode | Purpose | Environmental impact |
|---|---|---|
| Ocean shipping | International transport | Lowest emissions per tonne-km |
| Rail | Inland transport | Lower than road |
| Truck | Last-mile delivery | Moderate emissions |
| Air freight | Urgent deliveries | Highest — rarely used |
Lowest cost, highest carrying capacity and far lower emissions than air freight over long distances.
Port-to-warehouse and last-mile delivery to rooftops and solar farms, mostly on diesel.
Regional assembly plants reduce route length, breakage losses and exposure to supply-chain shocks.
Chapter 08
For 25–30 years the panel generates electricity with near-zero direct emissions, no fuel and minimal maintenance — steadily repaying its manufacturing debt. Carbon payback takes just 4–6 months in high-sunlight regions.
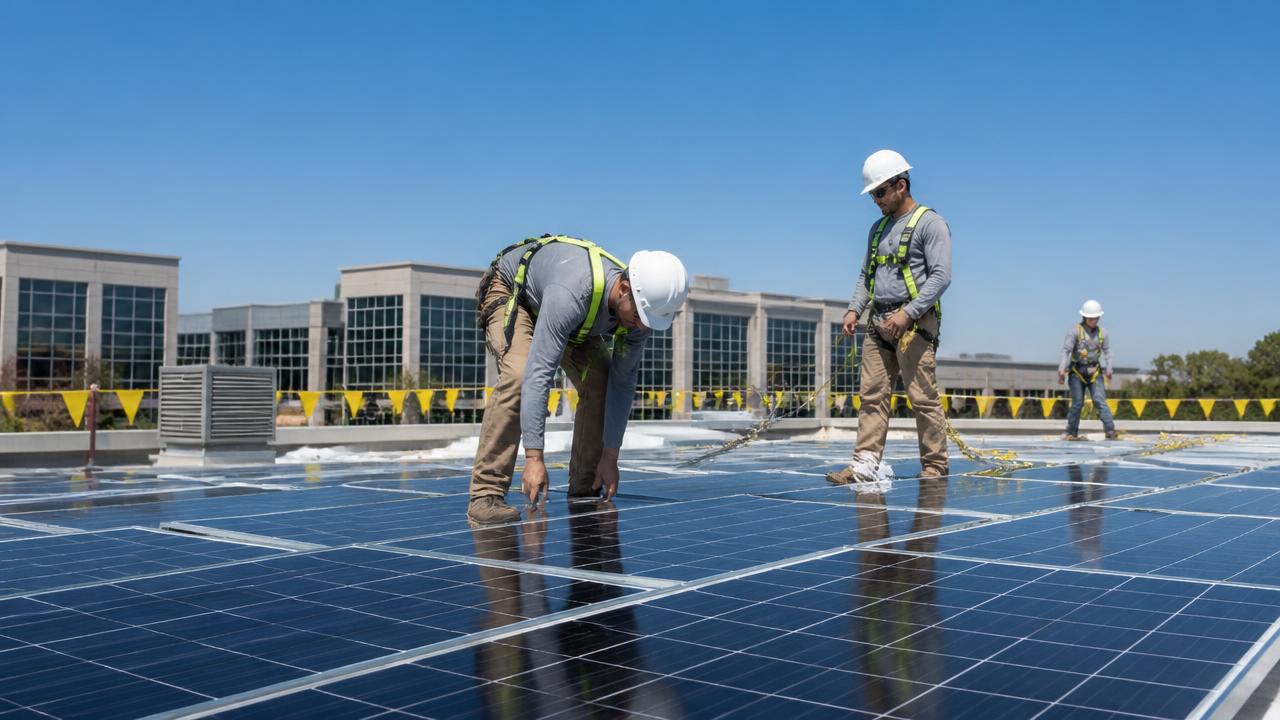
Illustrative rooftop array: manufacturing debt repaid within the first year.
Quality modules lose only 0.3–0.8% output per year, retaining 80–90% of original capacity after 25 years.
Cleaning, connection checks, output monitoring and one inverter replacement after 10–15 years. No moving parts.
Rooftops, commercial and industrial sites, utility-scale farms, floating plants and agrivoltaic farmland.
Carbon payback period by climate region
| Climate region | Carbon payback period |
|---|---|
| High sunlight regions | 4–6 months |
| Moderate sunlight regions | 6–8 months |
| Low sunlight regions | 8–12 months |
Chapter 09
Retiring panels are the next great waste stream. IRENA projects roughly 8 million tonnes of PV waste by 2030 and 78 million tonnes by 2050 — up to 95% of a module's mass is technically recoverable.
Million tonnes. Source: IRENA / IEA-PVPS projections.
Frames, junction boxes and glass are separated first — the high-volume, high- yield fraction.
Delamination recovers silicon wafers, silver and copper from the laminate sandwich.
Lightly degraded modules are reused in off-grid and low-demand applications.
Less mining, less landfill, lower emissions and new jobs in collection and recycling.
Chapter 10
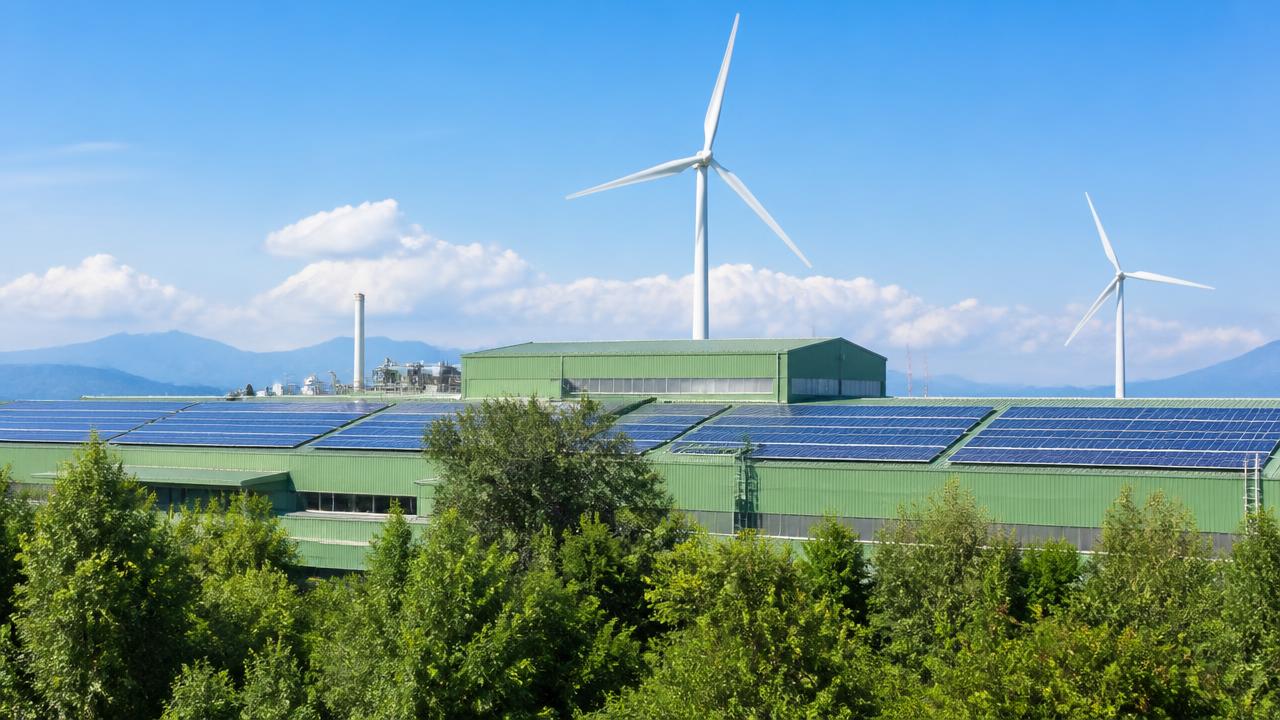
Adding it all up: manufacturing dominates at 60–80% of life-cycle emissions, transport is modest, and the use phase turns the balance sharply positive within the first year. Solar PV emits 90–97% less CO₂ per kWh than coal.
Median values, g CO₂e per kWh. Source: IPCC (2014).
Approximate contribution of each stage to total emissions.
20–50 g CO₂e per kWh across the life cycle, against 820 for coal and 490 for natural gas.
Concentrated in quartz washing, silicon purification and wafer cleaning — the use phase needs almost none.
Quarrying, tailings and land occupation of large ground-mount arrays; most materials are abundant or recyclable.
Silicon scraps, glass fragments, packaging waste, chemical sludge and end-of-life modules.
GHG Protocol scopes
| Scope | Description | Example |
|---|---|---|
| Scope 1 | Direct emissions | Fuel burned in factories |
| Scope 2 | Purchased electricity | Grid power for manufacturing |
| Scope 3 | Other indirect | Mining, transport, recycling |
Life Cycle Assessment under ISO 14040 / 14044
| Stage | What it covers |
|---|---|
| Goal & scope | Boundaries, functional unit, purpose |
| Inventory analysis | Resource inputs and emission data |
| Impact assessment | Translating inventory into impacts |
| Interpretation | Findings, limitations, improvement strategies |
Chapter 11
Pinpointing where the footprint is heaviest — and which trade policies could redraw the map. The stage that dominates emissions is also the stage most exposed to carbon pricing and geopolitical disruption.
Approximate kg CO₂e per kW of module capacity — the same panel, different grid.
The single largest hotspot: electricity-intensive refining concentrated on coal-heavy grids drives the bulk of life-cycle emissions.
High-temperature furnaces, ultrapure water and process chemicals — the second heaviest stage and the hardest to relocate.
Landfilled modules in markets with no recycling mandate lose recoverable glass, aluminium and silver and create a growing waste liability.
Disruption scenarios and life-cycle consequences
| Trigger | Life-cycle stage hit | Likely consequence |
|---|---|---|
| Carbon border levy | Manufacturing | Cost advantage shifts to clean-grid producers |
| Export controls on wafers | Upstream inputs | Assembly hubs idle within weeks |
| Shipping-route closure | Transportation | Longer routes, higher freight emissions |
| Local-content mandates | Manufacturing | Duplicated capacity, higher short-run prices |
| Extended producer responsibility | End of life | Recycling cost priced into the module |
| Silver price shock | Raw materials | Accelerated thrifting and substitution |
Chapter 12
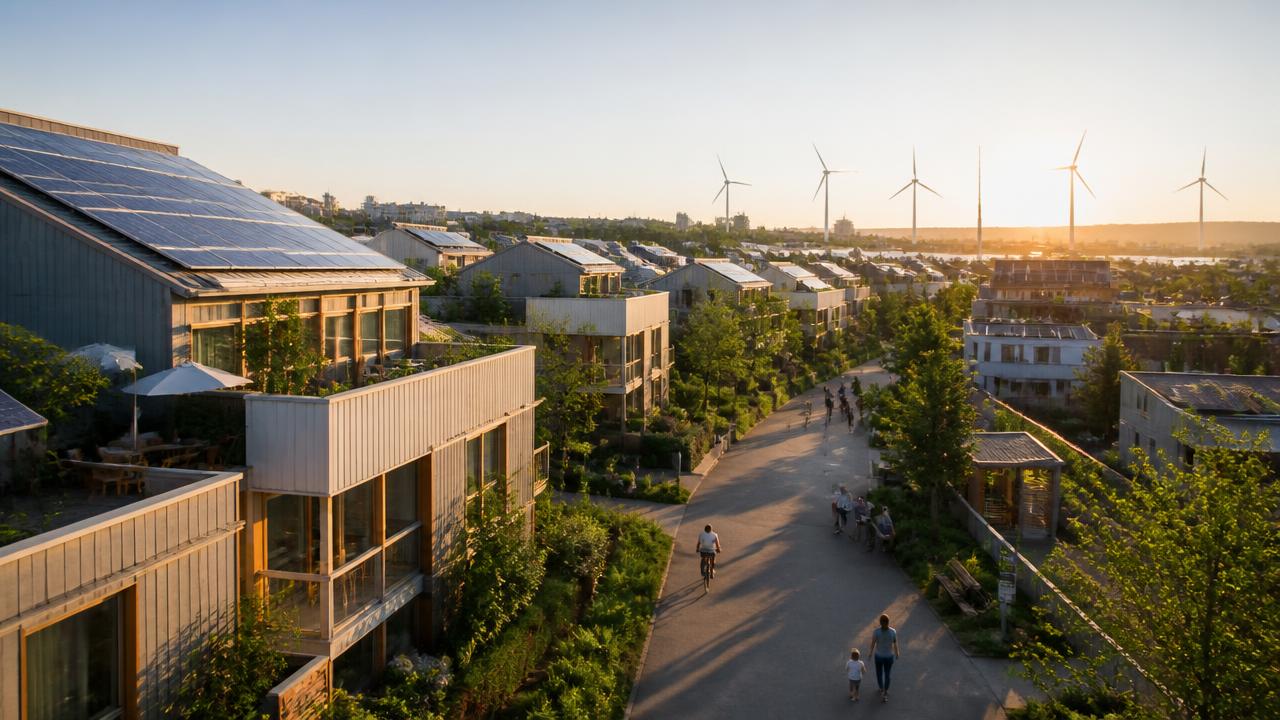
The panel's life cycle touches several UN Sustainable Development Goals — positively through clean power and innovation, and critically through mining, labour conditions and waste.
SDG 7
SDG 9
SDG 11
SDG 12
SDG 13
Chapter 13
Key sources underpinning the figures and case studies in this report.